
Cost benefit analysis and active transportation funding in Calgary's Barley Belt
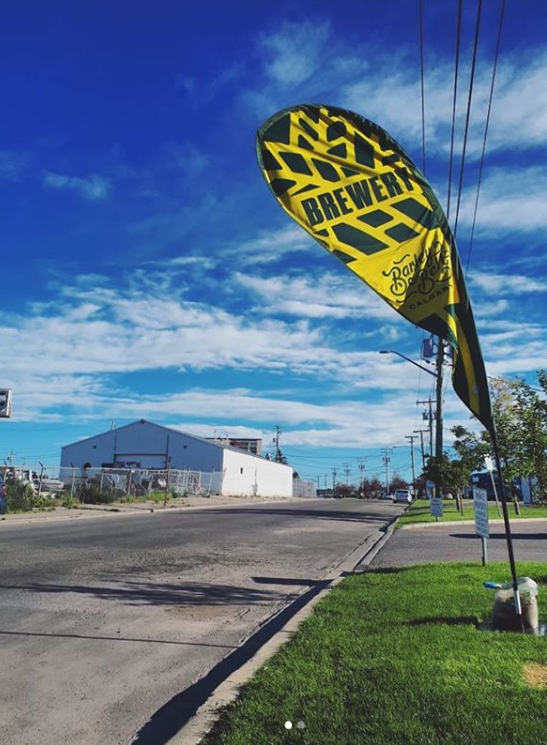
In late November 2018, Calgary City Council approved a $43 million capital spending package that is set to fund parks, pathways, upgrading recreation centers, planting trees in urban areas, and buying LRT cars. Within the spending package, $5.5 million dollars of funding has been set aside for active transportation in the Barley Belt, an area home to the city’s booming beer industry.
We like to consider both sides of the budget. Cost is important, but what outcomes, positive or negative, do we reap as a result of investing in a project or initiative? We’ve been thinking about cost benefit analysis a lot, and this budget announcement seemed particularly pertinent to the conversation.
In August 2018, Councillor Gian Carlo Carra said that making the Barley Belt in Calgary more friendly to active transportation was “a great economic development play for the city and it's a great tourism play for the city and it's a very necessary and fairly easy thing to do” (CBC News, August 8, 2018). Carra’s statement reflects two positive outcomes of better active transportation infrastructure in the Barley Belt: economic development and tourism. Places with a thriving beer culture see economic benefits. For example, breweries in the state of Maine “added a total of $228 million to Maine’s economy last year, and employed more than 1,600 workers, according to estimates based on survey responses from guild members. The estimated total revenue of Maine brewers was more than $150 million in 2016, a 17 percent increase from 2013, according to the report.” (McGuire, 2017).
Beyond these economic benefits, the community of Manchester where the Barley Belt is located will benefit from this funding increase. Though sparsely populated, the community is growing – and fast. Between 2009 and 2014, Manchester grew 118% compared to the rest of Calgary’s 12%. Manchester experiences higher than average levels of housing insecurity and poverty and is home to many new Canadians. The influx of funding to make the pedestrian realm better in the community will not only impact local business owners and tourists, but also community residents.
Further, the $5.5 million in funding mentions “priority pathway connections”. I live in the SW, two communities below the Rocky View Hospital. When I hop on my bike, there are plenty of obstacles in my way, especially when I get to Glenmore trail – crossing it is dodgy at best. Better connections to Calgary’s great pathway system would go a long way to improving safety and providing options for Calgarians to get around their city.
This is just a fraction of the outcomes we could expect when we invest in active transportation infrastructure in our city. Yes - there is the cost of construction and maintenance, but we can’t ignore the other side of the budget: greater community connection, increased physical activity, and tourism.
——
Read our cost benefit analysis paper summary below
—-
Perhaps it is easy to see the benefit of a highway, of a stretch of asphalt, lights and guardrails that move hundreds of thousands of cars every day. As members of a car-reliant society, we’ve grown familiar with the perks that these roads provide, they are known to us: movement of people, movement of goods. Many of our provincial transportation ministries deal in everything vehicular: overpasses, highways, exchanges. But what of a bike lane, or a sidewalk? Is there as much clarity when it comes to the benefits they provide?
There are benefits, and lots of them
Years of research have told us that the benefits of quality active transportation infrastructure are vast, and the stakeholders seemingly endless. We know that increased physical activity, like biking to work or walking to get your groceries, results in many benefits including:
Better physical and mental health outcomes,
A reduction in cardiovascular disease, stroke, obesity, osteoporosis, depression and respiratory disease (Carrick, 2013; Litman, 2018; Kelly et al., 2014),
Lower rates of absenteeism from work (Deenihan & Caulfield, 2014),
An increase in property values in residential areas located close to public trails,
A reduction in cognitive decline and dementia, found in those who walk more (Litman, 2018)
Our research
We know the benefits of good active transportation infrastructure, but we also know that they are not as broadly accepted as infrastructure made for cars, an overpass for example. However, to communicate these benefits to decision makers, we are tasked with presenting the profitability of an active transportation project. But how are those benefits measured? How can we demonstrate the value of such a project? We wanted to learn more, so we commissioned a piece of research to dig a little deeper.
We conducted a scoping review of 29 research articles and 37 grey literature reports to address the following question: in cost benefit analysis literature, what are the population health equity benefits of active transportation infrastructure projects?
What we learned was that the methods that exist to measure the benefits of these projects are limited and in early stages of development. Yet they do provide us with some tools to work with. These tools have demonstrated the relationship between active transportation and health. For example, the evidence that links increased physical activity to decreased health care costs, better health outcomes, and reduced premature death is growing (de Hartog, Boogaard, Nijland, & Hoek, 2010; Deenihan & Caulfield, 2014; Macmillan et al., 2014; Oja et al., 2011; Pucher & Buehler, 2010; Teschke, Reynolds, Ries, Gouge, & Winters, 2012). However, consensus about how to measure more intangible social benefits, like enjoying one’s commute or the development of a close-knit community, is lacking - we simply do not know how best to conceptualize and measure these outcomes.
Beyond measuring outputs, we found that some researchers argue we must focus on the capacity of people and organizations to act. Though partnerships and stakeholder participation are not requirements of the types of analyses we looked into, there were many examples of intersectoral collaboration, community involvement, and government consultation (Smith Fowler et al., 2016).
How, and why, we measure these benefits
Consider this: last winter, my neighbour broke her arm slipping on ice, so I drove her kids to school for a week. We drove because the route to their school was simply not safe to walk – when it came time to cross the six lane, 70 kilometer per hour road that lay between their house and their school, there was no proper crosswalk or pedestrian overpass.
We know the value of that impassable road, we see trucks laden with food bound for supermarkets, people going to work, and kids getting dropped off at school. Yet, we also know that when those same kids bike or walk to school (increased physical activity), they have “better academic achievement, better concentration, better classroom behaviour, and more focused learning.” (Ontario Ministry of Education, 2015, p.1). But these facts are not common knowledge – not to the same sweeping extent that “the efficient movement of people and goods” is, however relevant to each and every one of us.
Considering that a whopping 62% of Canadian kids get to school using an inactive means of travel, like a car, bus, or train, it is important that people have access to information about why other forms of transportation are important (Canadian Fitness & Lifestyle Research Institute, 2013). Like our research found, ways to measure these benefits are in the early stages, but there are tools at our disposal that can assist us in making the case for quality active transportation infrastructure. Below, you will find examples on the types of analyses we explored.
Cost Benefit Analysis
When we measure the benefits of active transportation infrastructure, we typically use the “gold-standard” of economic assessments: a cost benefit analysis. Much as it sounds, a cost benefit analysis looks at a program (let’s say city council wants to build better bike infrastructure) and considers both the cost (building a bike lane) and the outcomes (increased physical activity, decreased congestion) and turns that information into dollars.
Yet, during this process, who is deciding what exactly counts as a benefit and then for measuring it? This question is important for the simple fact that not everyone will see the same thing as a benefit. Yet, active transportation infrastructure provides benefits to our society that are not immediately and obviously measurable. Many argue that these benefits, such as a more cohesive community and feelings of security can be tricky to measure in monetary terms and are “overlooked and undervalued” (Litman, 2018, p.1; Van Wee & Börjesson, 2015). So, if our traditional measurement tool, the cost benefit analysis, is a little too narrow to capture the value of these things, let’s talk about other tools we can use to measure them.
Social Cost-Benefit Analysis
A more broad type of analysis that is capable of capturing even the most intangible benefits on the list is a social cost-benefit analysis. It works much like a cost-benefit analysis, but differs in that it considers the social benefits of a project, and has the capablity to address equity concerns by analysing how costs and benefits are distributed across groups. Its broad scope allows for comparisons to other projects, taking “different economic risks and uncertainties into account, providing decision-makers with choices and options” (Smith Fowler et al., 2016, p. 10).
A social cost-benefit analysis conducted on behalf of the Dutch Ministry of Infrastructure and Environment found that “A switch from bus to bike yields a social gain of around 50 cents. A shift from car to bike outside urban areas yields 4-7 cents per kilometer; in urban areas this is 10 to 41 cents.” (Decisio, 2012, p.3).

Figure 1: Social effects modal shift per kilometer [online image] Retrieved from Decisio, 2012, https://docplayer.net/22245384-Social-costs-and-benefits-of-investments-in-cycling.html
Social Return on Investment
Social return on investment is a relatively new analysis tool similar to a social cost benefit analysis, in that it gives a monetary value to intangible project outcomes. However, it differs in that it measures the value the project gives stakeholders and uses economic language to communicate the value in a way that stakeholders will understand. For this reason, non-profits have used this method to demonstrate to the social impact of their service to funders (Smith Fowler et. al., 2016). So, if a bike lane was being considered in your city , this tool would measure the value it would provide to stakeholders, like city council, bike lane-users, the surrounding homes and businesses, and the community it sits within.
World Health Organizations Health Economic Assessment Tool (HEAT)
The World Health Organization’s Health Economic Assessment Tool (HEAT) for cycling and walking is an entire online database that aims to measure, explore, and reduce health inequalities. It can calculate the answer the question: “if x people cycle or walk y distance on most days, what is the economic value of mortality rate improvements?”. Regular walking and cycling reduces mortality, and this tool has been used throughout the world to estimate the value that this brings to a society (World Health Organization, 2018). This tool has many strengths, like continuous updating, its population level use, and the inclusion of both cycling and walking. However, adults with average levels of physical activity are the main focus of the tool, meaning that it cannot be used to measure children, youth, seniors, or people with disabilities. Considering that only two out of every 10 Canadian adults fall into this category, the HEAT tool has some limitations (Public Health Agency of Canada, 2016).
A study conducted in Ireland used the HEAT tool to determine the potential impact of a segregated cycleway. The tool found that the project could “reduce the number of deaths per year by between 3.39 and 17.93” (Deenihan & Caulfield, 2014, p.148). The tool also found that after ten years, for every euro spent, between €2.22 and €11.77 would be accumulated in benefits.
Using the tools at our disposal
In our car-reliant society, we don’t have to be a transportation engineer or urban planner to know the benefits of cars and roads. We can observe this in the process, where the time spent debating a project versus its cost can often seem out of balance. The cost of a bike lane is minimal, yet the debate is fierce. On the other hand, a multi-million dollar overpass faces little community deliberation. But the outcomes of these projects affect the choices we make. As it stands today, 4/5 Canadian commuters use private vehicles, compared to less than 6 out of 100 people who walk and only 1 out of 100 who bike.
Options are important, important for our health, community well being, and even the simple action of enjoying our commute. Yet to create these options, to help build healthier, more connected communities, we have to know how to communicate their value. Our research demonstrated that there are tools, and that though they are in their early stages of development, some are quite robust.
However, to use them to their greatest extent, we must find opportunities to collaborate across sectors, encourage data collection at the local level, and educate community members and decision makers to use these types of analysis in a participatory framework. If we can do so, we may enhance our ability to assign value to undervalued infrastructure and make the benefits of active transportation infrastructure as widely known as that of an overpass.
By Katie Lore
References:
Canadian Fitness & Lifestyle Research Institute. (2013). Getting Kids Active! Transportation among children and youth. Retrieved from https://www.cflri.ca/sites/default/files/node/1235/files/CFLRI%20PAM%202010-2011%20Bulletin%2010%20EN.pdf
Carrick, K. (2013). Glasgow Health Walks Social Return on Investment Analysis: 1st April 2011 to 31st March 2012. Retrieved from http://www.pathsforall.org.uk/component/option,com_docman/Itemid,537/gid,774/task,doc_download/
CBC News. (August 8, 2018). Breweries, cyclists push to make Barley Belt more bike friendly. Retreieved from https://www.cbc.ca/news/canada/calgary/calgary-barley-belt-cycling-infrastructure-1.4777412
City of Calgary. (n.d.). The City of Calgary Community Profiles: Part B – Community Character (socio-economic information) Manchester. Retrieved from http://www.calgary.ca/CSPS/CNS/Documents/community_social_statistics/Manchester_b.pdf
Decisio Economic Consulting. (2012). Social costs and benefits of investments in cycling. Retrieved from https://docplayer.net/22245384-Social-costs-and-benefits-of-investments-in-cycling.html
de Hartog, J. J., Boogaard, H., Nijland, H., & Hoek, G. (2010). Do the health benefits of cycling outweigh the risks? Environmental Health Perspectives, 118(8), 1109–1116. https://doi.org/10.1289/ehp.0901747
Deenihan, G., & Caulifield, B. (2014. Estimating the health economic benefits of cycling. Journal of Transport and Health, 1(2), 141-149. https://doi.org/10.1016.j.jth.2014.02.001
Kelly, P., Kahlmeier, S., Gotschi, T., Orsini, N., Richards, J., Roberts, N., … Foster, C. (2014). Systematic review and meta-analysis of reduction in all-cause mortality from walking and cycling and shape of dose response relationship. International Journal of Behavioral Nutrition and Physical Activity, 11(1). https://doi.org/10.1186/s12966-014-0132-x
Litman, T. (2018). Evaluating Active Transport Benefits and Costs: Guide to Valuing Walking and Cycling Imrpovements and Encouragement Programs. Victoria Transport Policy Institute. Retreived from http://www.vtpi.org/nmt-tdm.pdf
Macmillan, A., Witten, K., Kearns, R., D.Rees, & Woodward, A. (2014). The societal costs and benefits of commuter bicycling: simulating the effects of specific policies using system dynamics modeling. Environ Health Perspect, 122(4), 335–344. https://doi.org/10.1289/ehp.1307250
Maizlish, N., Woodcock, J., Co, S., Ostro, B., Fanai, A., & Fairley, D. (2013). Health cobenefits and transportation-related reductions in greenhouse gas emissions in the San Francisco Bay Area. American Journal of Public Health, 103(4), 703–709. https://doi.org/10.2105/AJPH.2012.300939
McGuire, P. (March 21, 2017). Craft breweries added $228 million to Maine’s economy last year. The Portland Press Herald. Retrieved from https://www.pressherald.com/2017/03/20/craft-breweries-add-228-million-to-maines-economy/
Mulley, C., Tyson, R., McCue, P., Rissel, C., & Munro, C. (2013). Valuing active travel: Including the health benefits of sustainable transport in transportation appraisal frameworks. Research in Transportation Business and Management, 7, 27–34. https://doi.org/10.1016/j.rtbm.2013.01.001
Ontario Ministry of Education. (2015). Quick Facts for Parents: Learning about Active Transportation, Including Cycling. Retrieved from http://www.edu.gov.on.ca/eng/curriculum/elementary/transportfact.pdf
Public Health Agency of Canada. (2016). Health Status of Canadians 2016: A Report of the Chief Public Health Officer. Retreived from http://healthycanadians.gc.ca/publications/department-ministere/state-public-health-status-2016-etat-sante-publique-statut/alt/pdf-eng.pdf
Smith Fowler, H., Lalonde, P., Mák, G., & Gyarmati, D. (2016). Considerations for assessing the economic value of population health interventions. Social Research and Demonstration Corporation. Ottawa, ON. Retrieved from http://www.srdc.org/media/200027/phac-report-en.pdf
Statistics Canada. (2011). Commuting to work: National Household Survey (NFS), 2011. Catalogue no. 99-012-2011003. Retrived from https://www12.statcan.gc.ca/nhs-enm/2011/as-sa/99-012-x/99-012-x2011003_1-eng.pdf
Van Wee, B., & Börjesson, M. (2015). How to make CBA more suitable for evaluating cycling policies. Transport Policy, 44, 117–124. https://doi.org/10.1016/j.tranpol.2015.07.005
World Health Organization. (2018). Health economic assessment tool (HEAT) for cycling and walking. Retrieved from http://www.euro.who.int/en/health-topics/environment-and-health/Transport-and-health/activities/guidance-and-tools/health-economic-assessment-tool-heat-for-cycling-and-walking